Case study 02 · Internal tooling
TechBag IQ
Ordering a laptop bag full of peripherals was a text message, a hallway conversation and an invoice that showed up six weeks later. So I built the system that would replace all three — a storefront on the front, a command center on the back, and one tracked loop connecting them. It runs today as a working prototype; it is now in front of Exec IT as a pilot proposal.
The problem
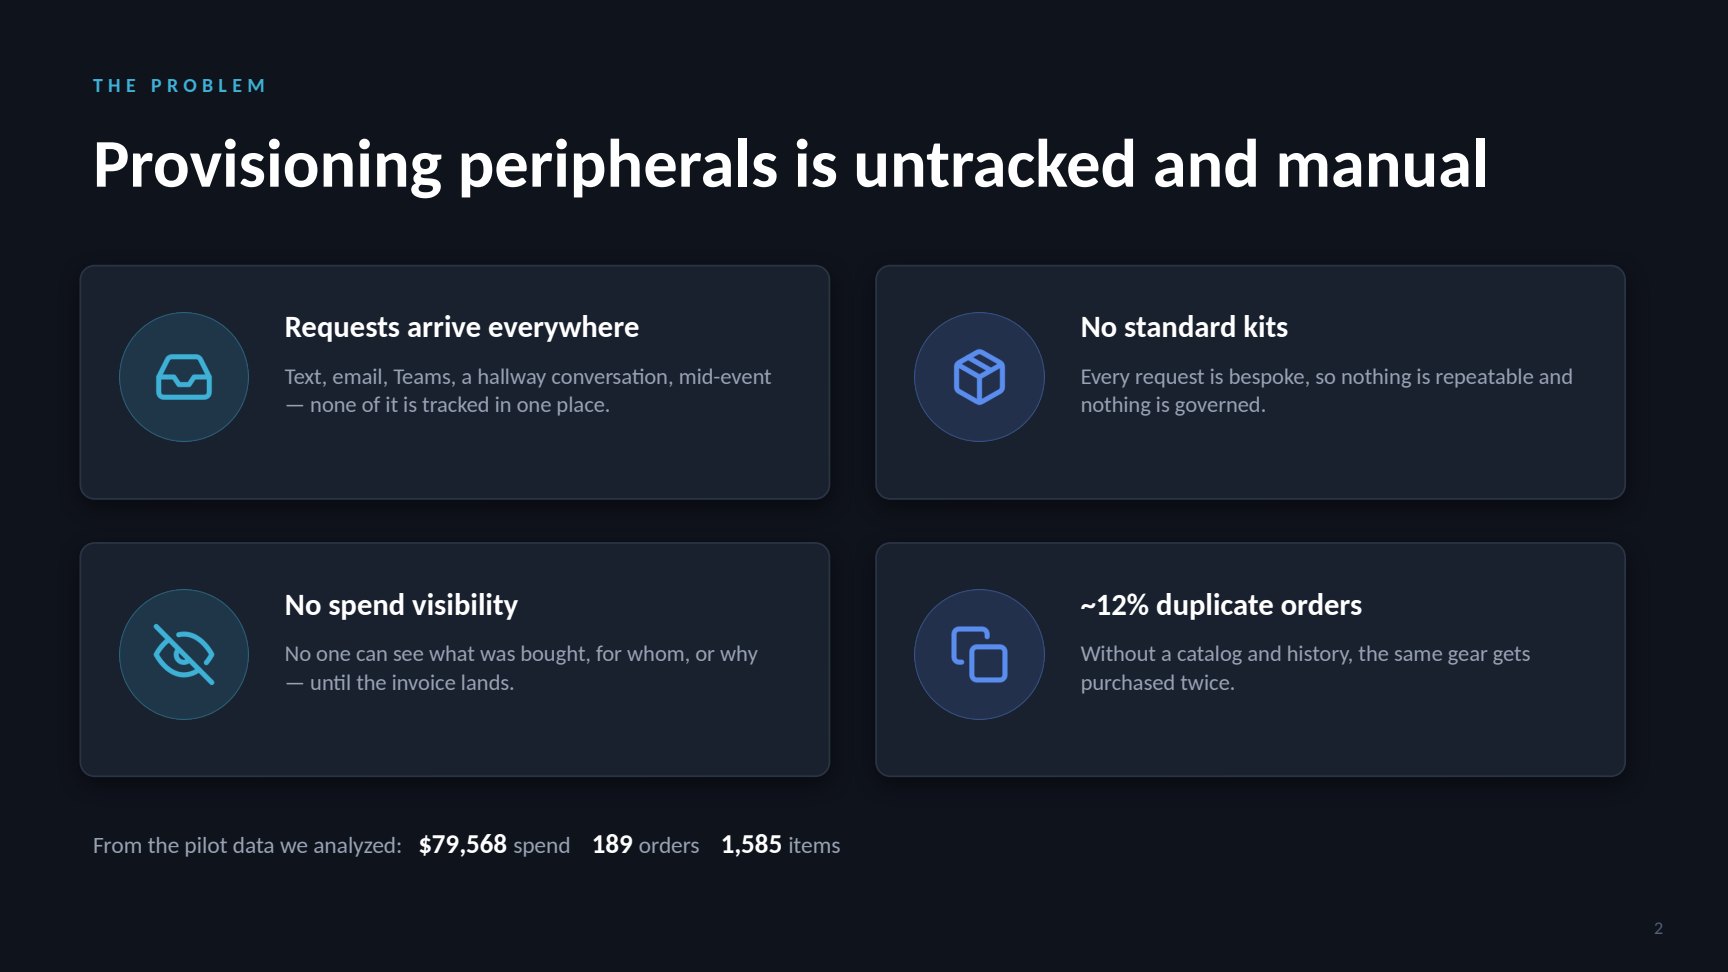
Provisioning peripherals is the kind of work that never appears on a roadmap because it never appears anywhere. Requests arrive by text, by email, in Teams, in a hallway, sometimes in the middle of an event. There is no standard kit, so every request is bespoke and nothing is repeatable. Nobody can see what was bought, for whom, or why — until the invoice lands. And because there is no catalog and no history, the same gear gets purchased twice.
Provisioning peripherals is untracked and manual. The problem, in one line — slide 2
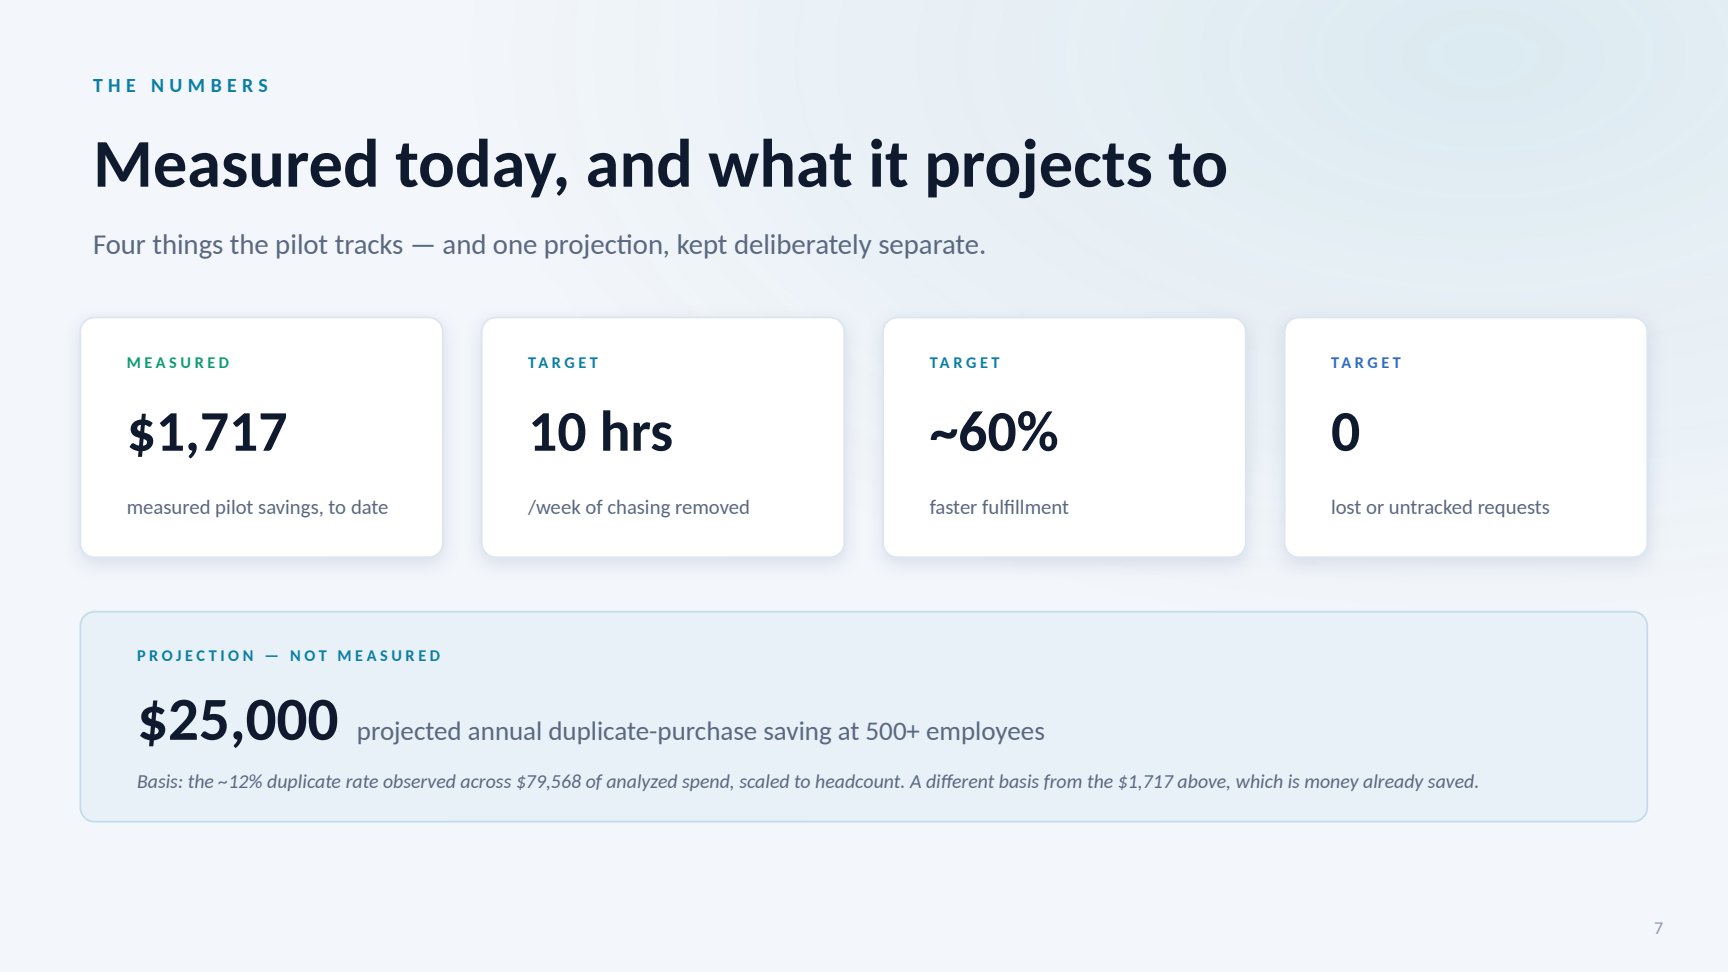
That last part is the one worth measuring. Across the spend I analysed, roughly 12% of orders were duplicates — gear the organisation already owned, bought again because there was no way to know it existed. The pilot dataset behind that number is $79,568 of spend, 189 orders and 1,585 items.
The approach
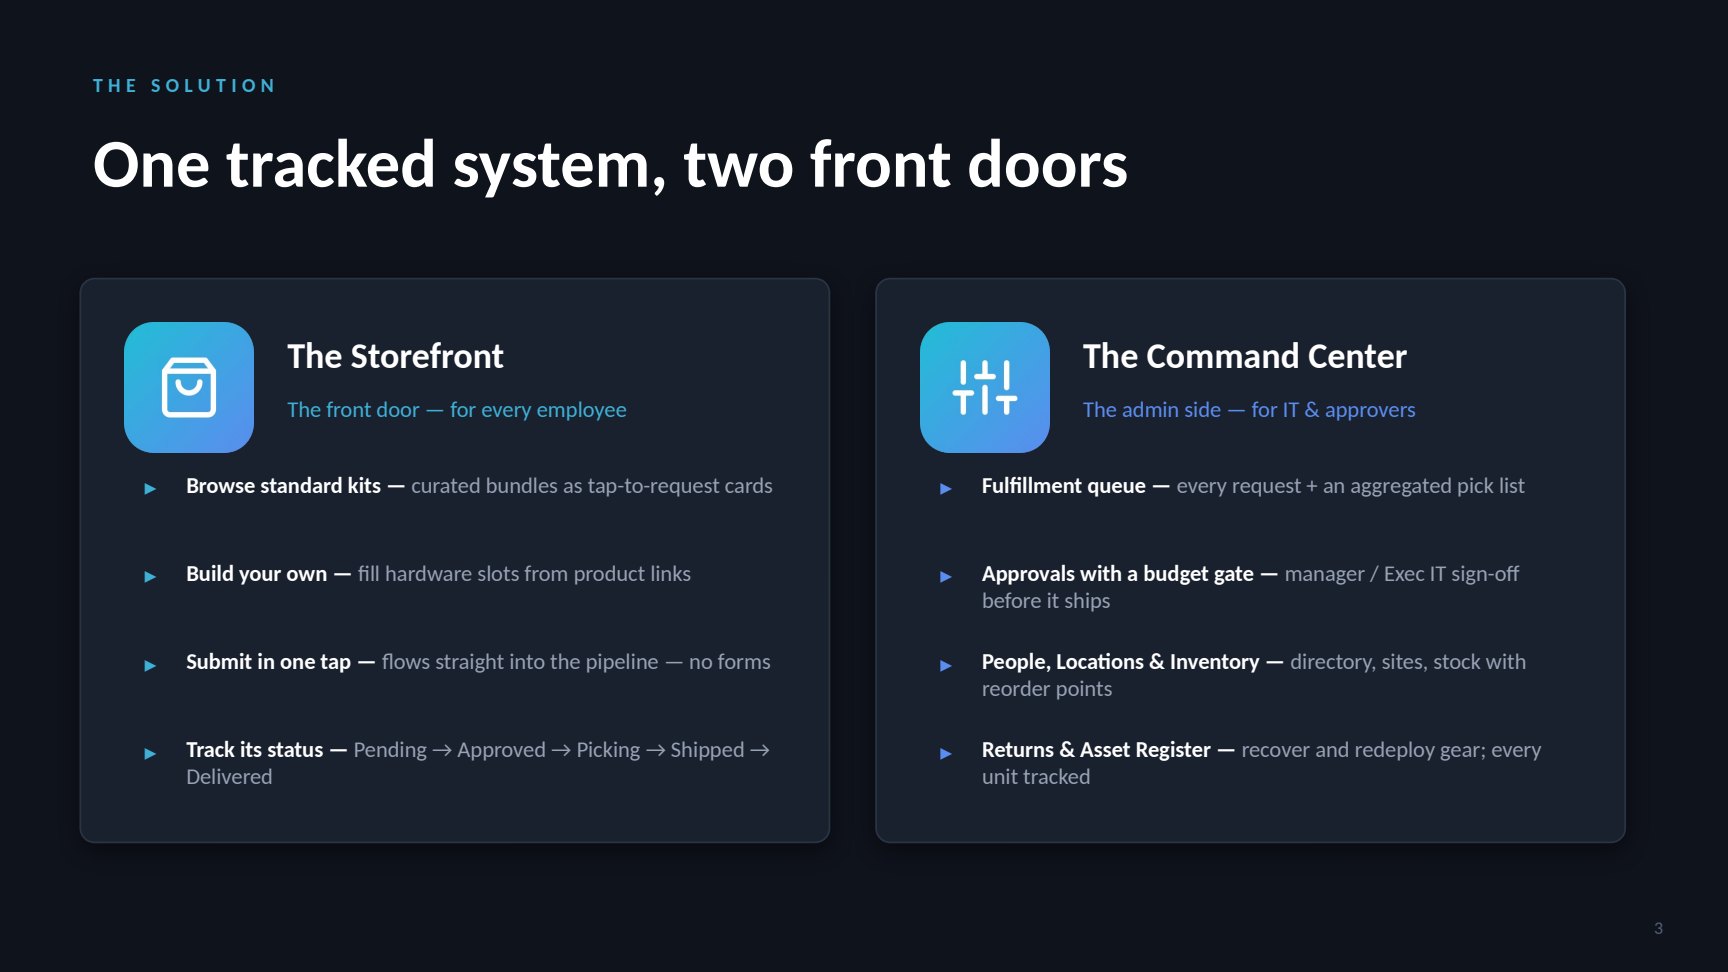
One tracked system with two front doors. Employees get a storefront; IT gets a command center. Both write to the same record, so there is exactly one version of what was asked for, what was approved and what shipped.
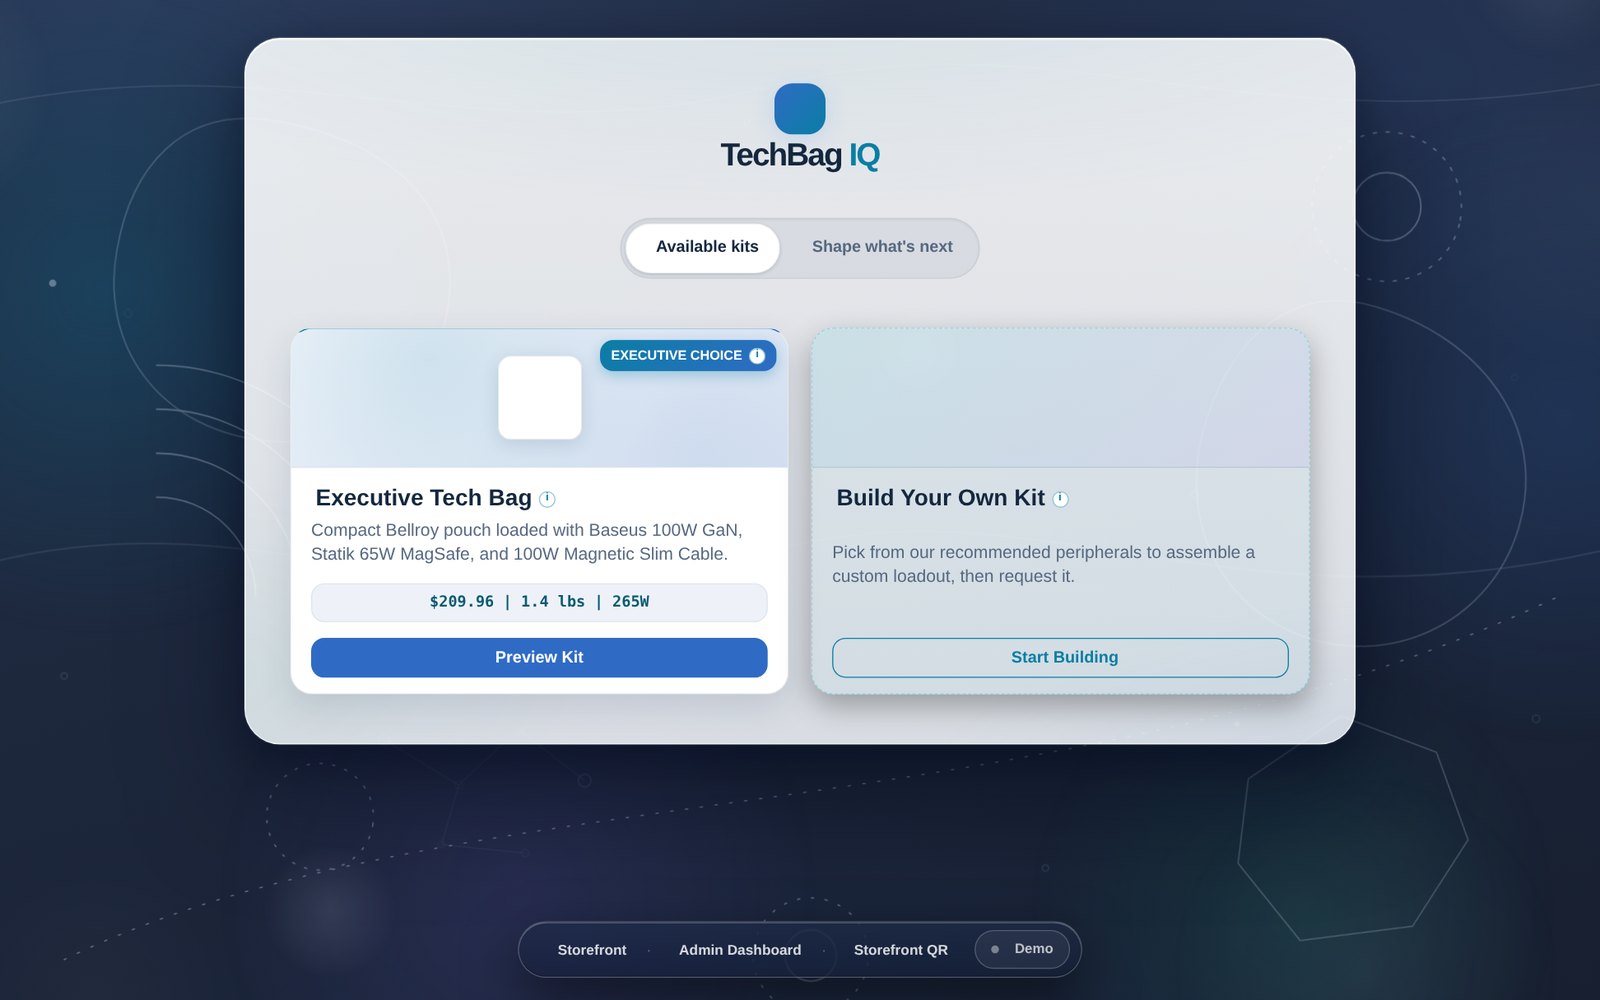
Standard kits as tap-to-request cards, or build your own from curated hardware. Submit in one tap, then watch it move: Pending → Approved → Picking → Shipped → Delivered.
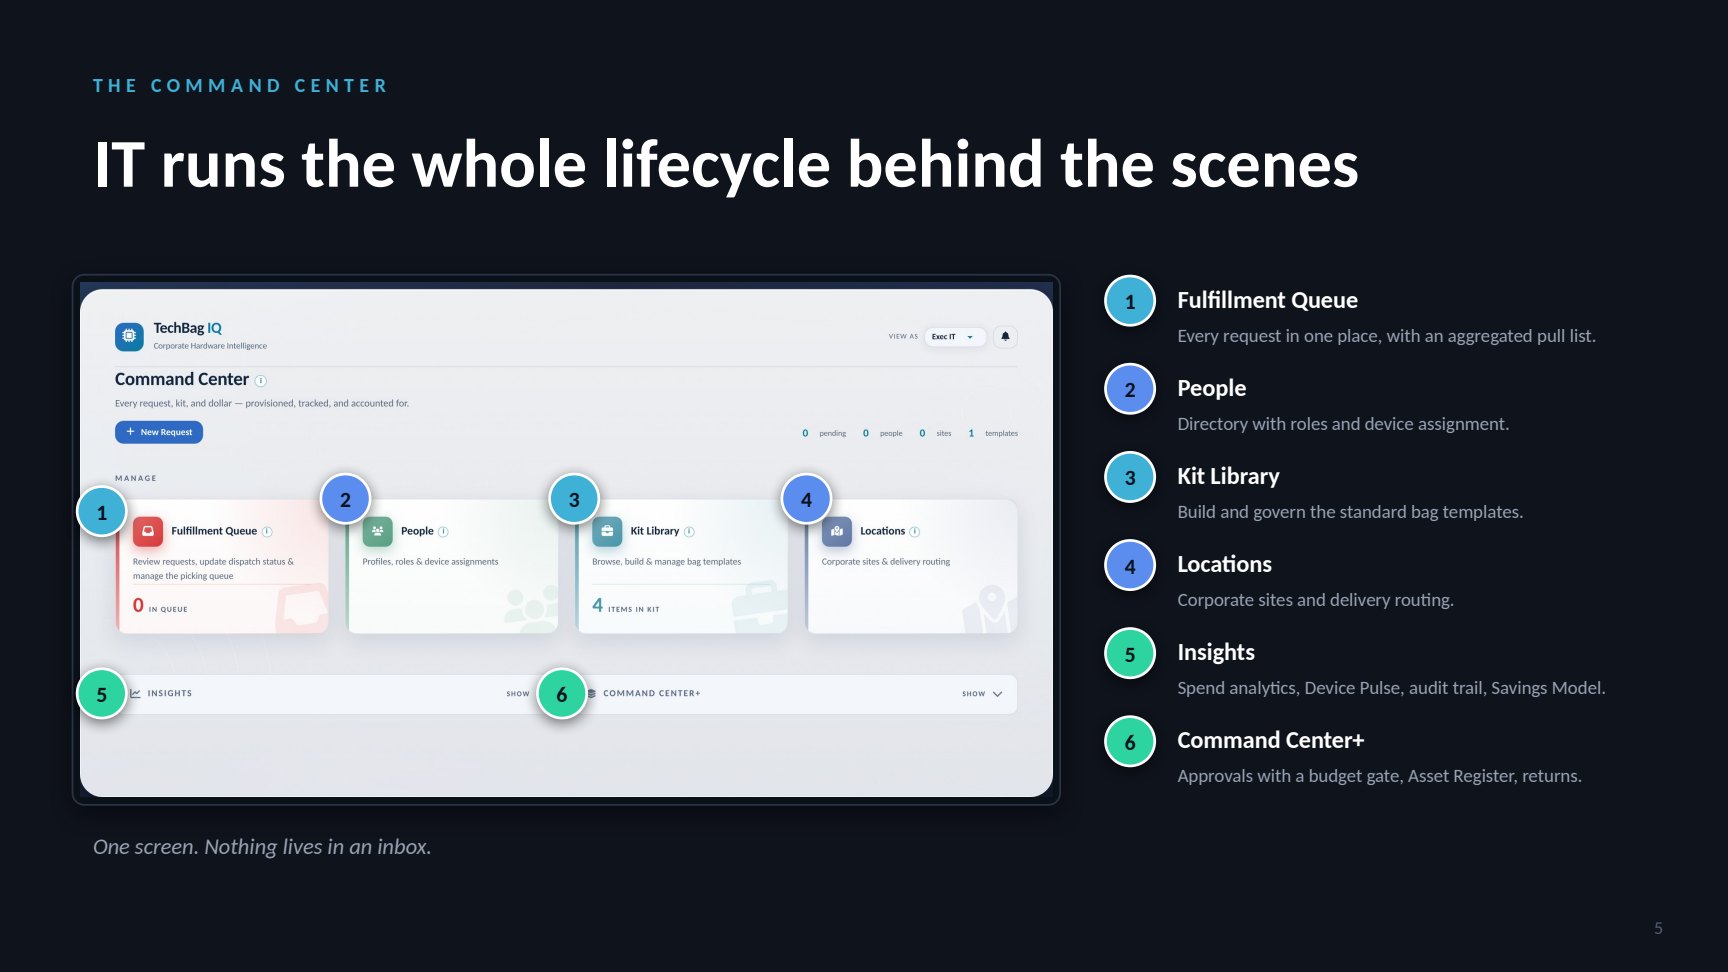
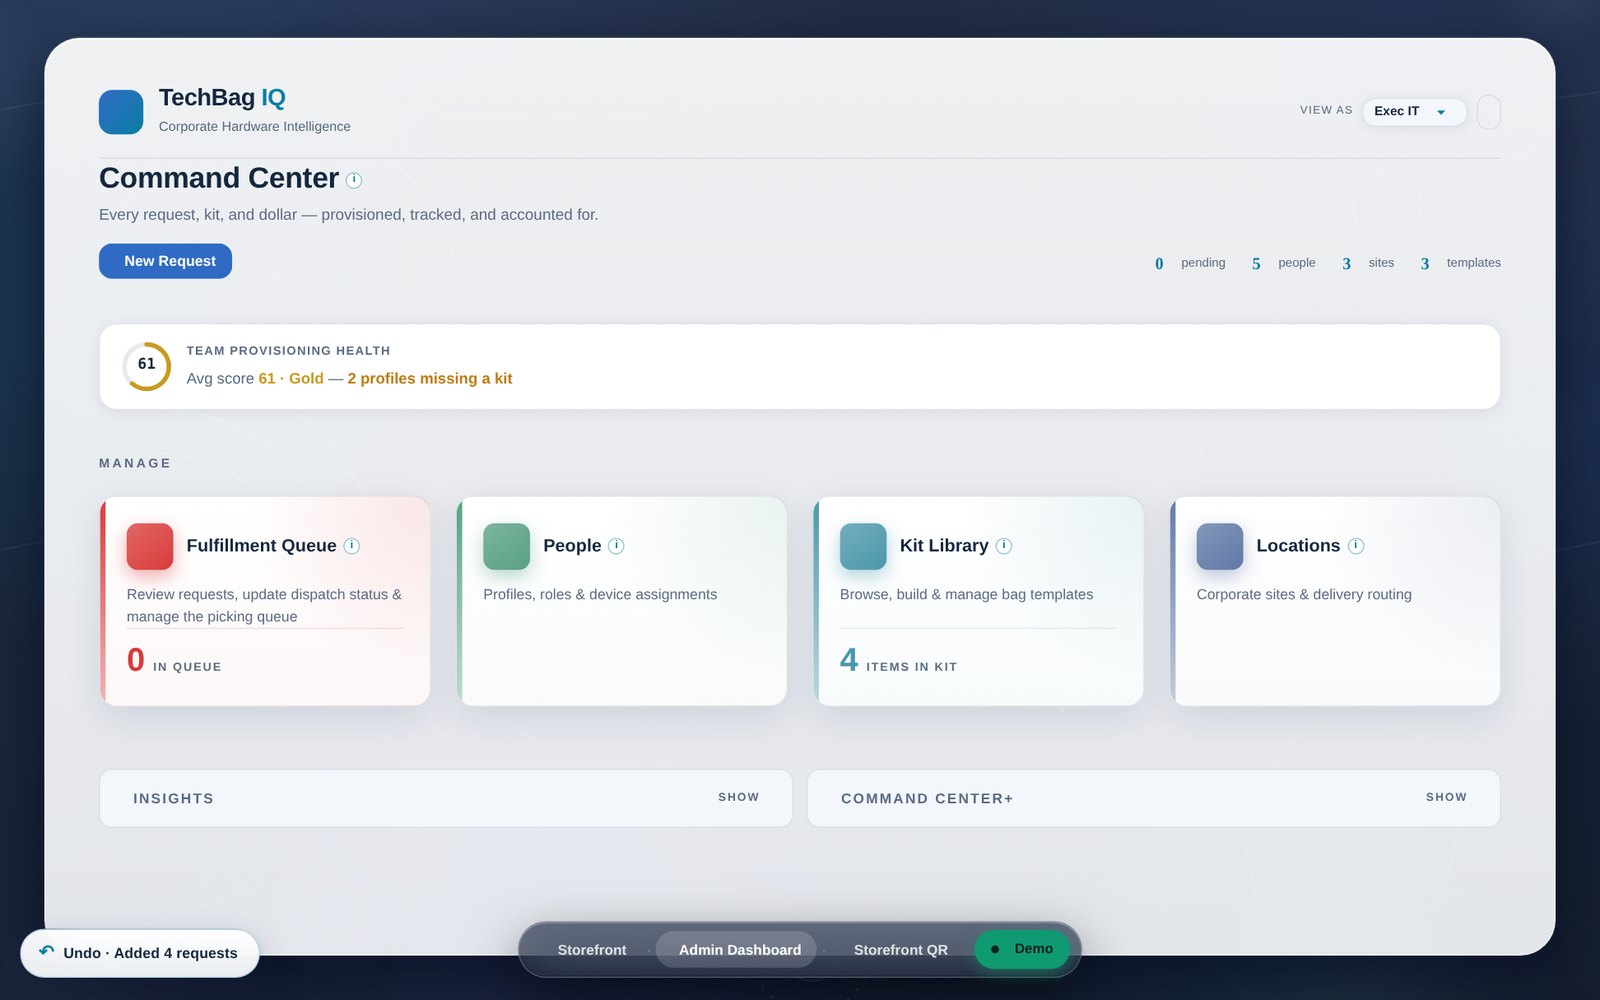
Fulfillment queue with an aggregated pick list, approvals behind a budget gate, people and locations, asset register and returns. One screen, nothing living in an inbox.
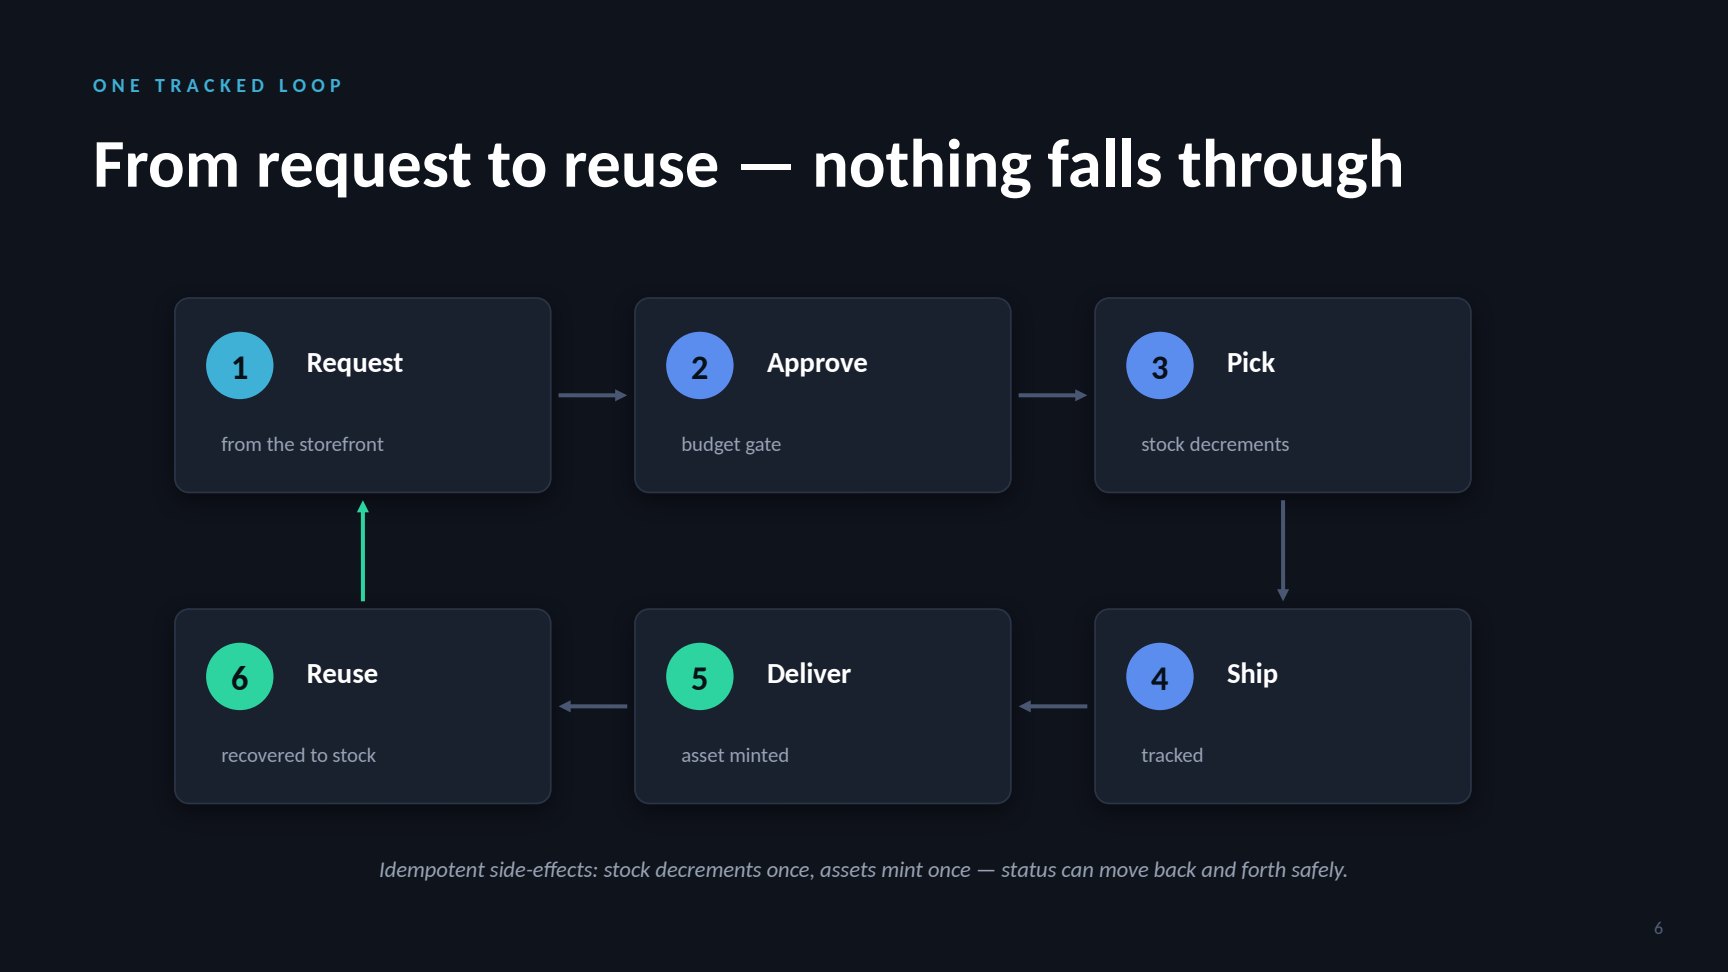
Request → Approve → Pick → Ship → Deliver → Reuse. Stock decrements once, assets mint once — the side-effects are idempotent, so a status can move backwards safely.
Kits are governance in disguise
The storefront looks like shopping, and that is deliberate — but the catalog is a governed template. IT curates what appears there, which means the fastest path for an employee is also the compliant one. You do not need a policy document to stop bespoke ordering if the standard kit is two taps and the alternative is an email.
What is measured, and what is projected
These are deliberately kept apart, because they rest on different evidence. The left-hand figure is money already saved. The right-hand figure is a model.
Idempotent side-effects: stock decrements once, assets mint once — status can move back and forth safely. Slide 6
A prototype with an exit route
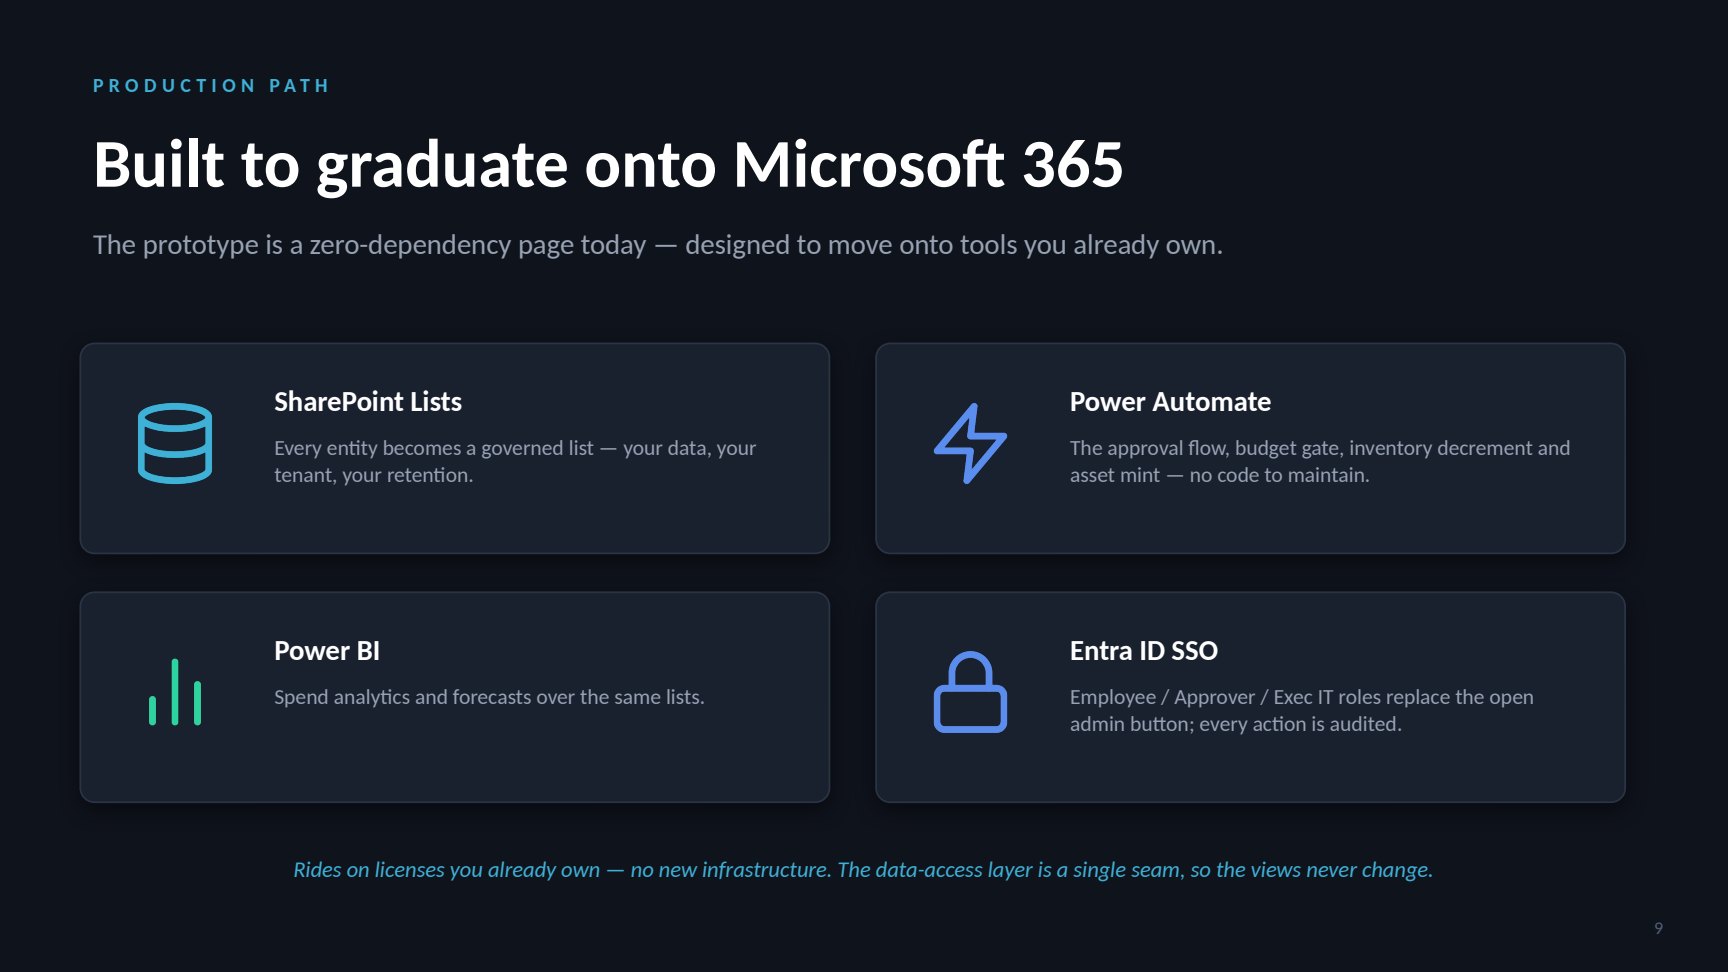
The thing that usually kills an internal tool is not the tool — it is the honest question of who maintains it. So the architecture answers that up front. Every entity in the prototype maps to a SharePoint list; the approval flow, budget gate, inventory decrement and asset mint map to Power Automate; analytics map to Power BI; the open admin button is replaced by Entra ID roles. The migration is four phases with a dual-write cutover in the middle, flipped one entity at a time once verified. Views, roles and data shapes never change — the cutover is invisible to employees.
The artifacts
Two things shipped: the app itself, and the pitch that asks for a pilot. The app is not a mockup — it is the working product, and it is embedded here so you can use it rather than read about it.
The storefront
The command center
About the data in the live build. The five headline figures — $79,568 of spend, 189 orders, 1,585 items and $1,717 saved — are the real analysis, and they are the same numbers the deck presents. Everything underneath them in the public build is sanitized: supplier, brand and product names are replaced with sample labels so no internal purchase detail is published. Chart shapes and magnitudes are unchanged.
The ask
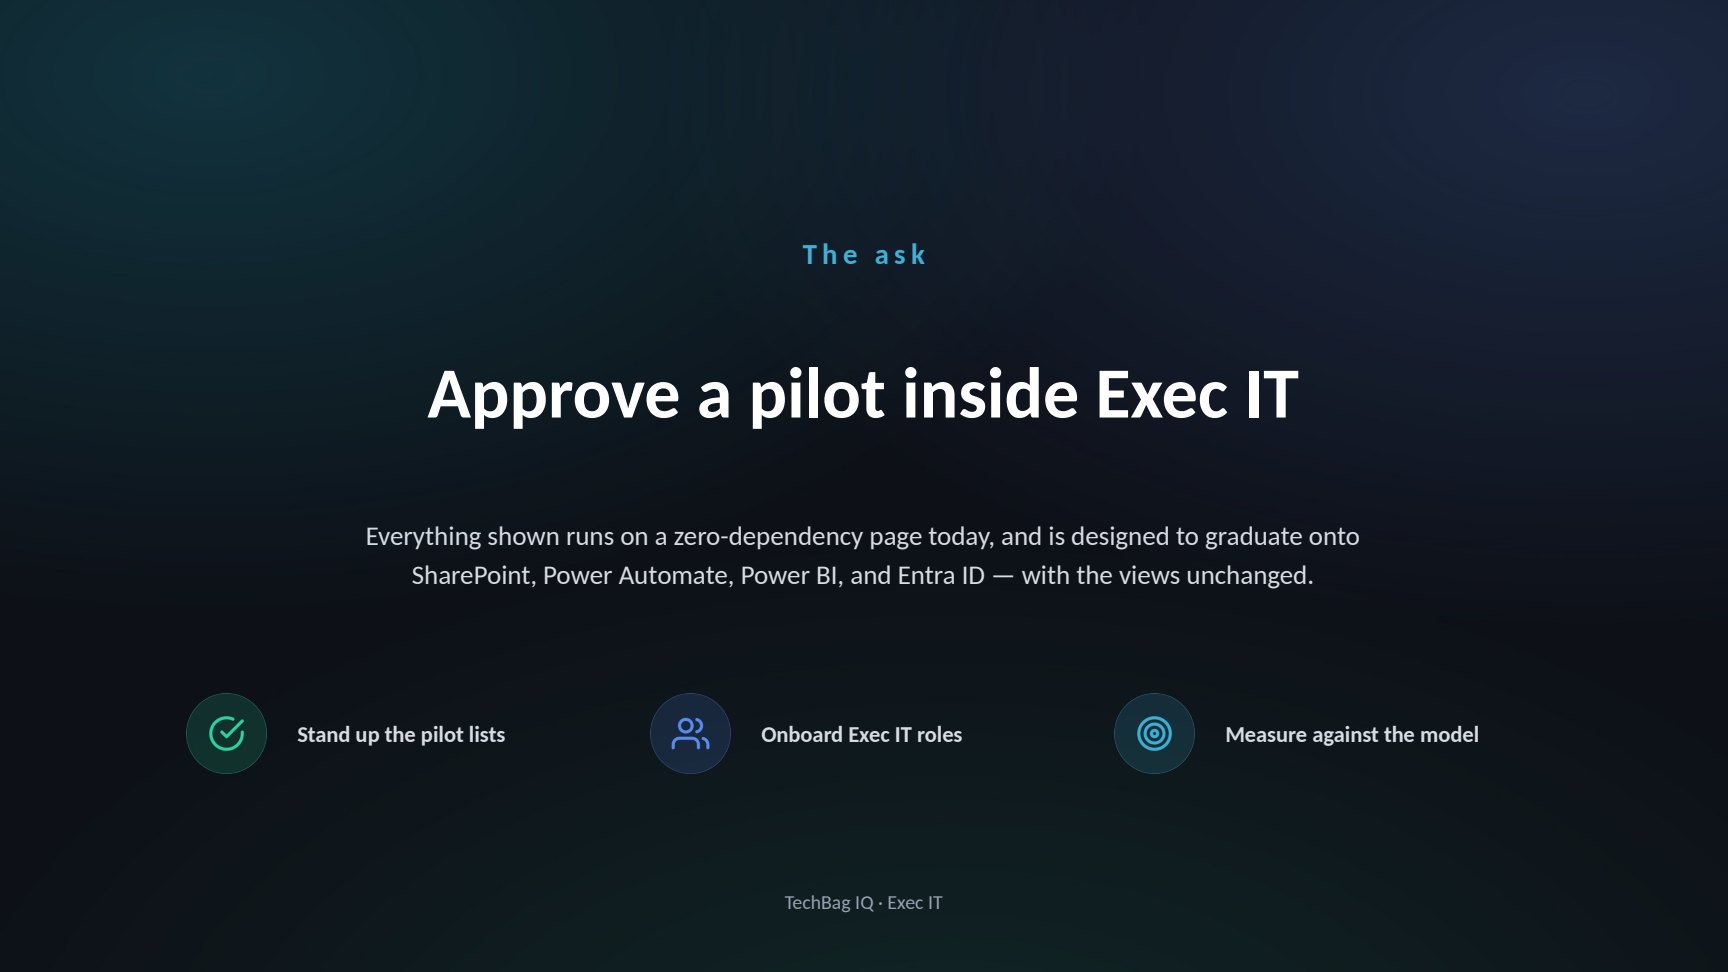
The deck does not ask for a budget or a rollout. It asks to stand up the pilot lists, onboard Exec IT roles, and measure the thing against its own model — which is the only honest next step when half your numbers are still projections.
Downloads
The app runs in the browser with nothing to install. The deck is the eleven-slide version that went to Exec IT.